Building a Vision
2010 – 2015
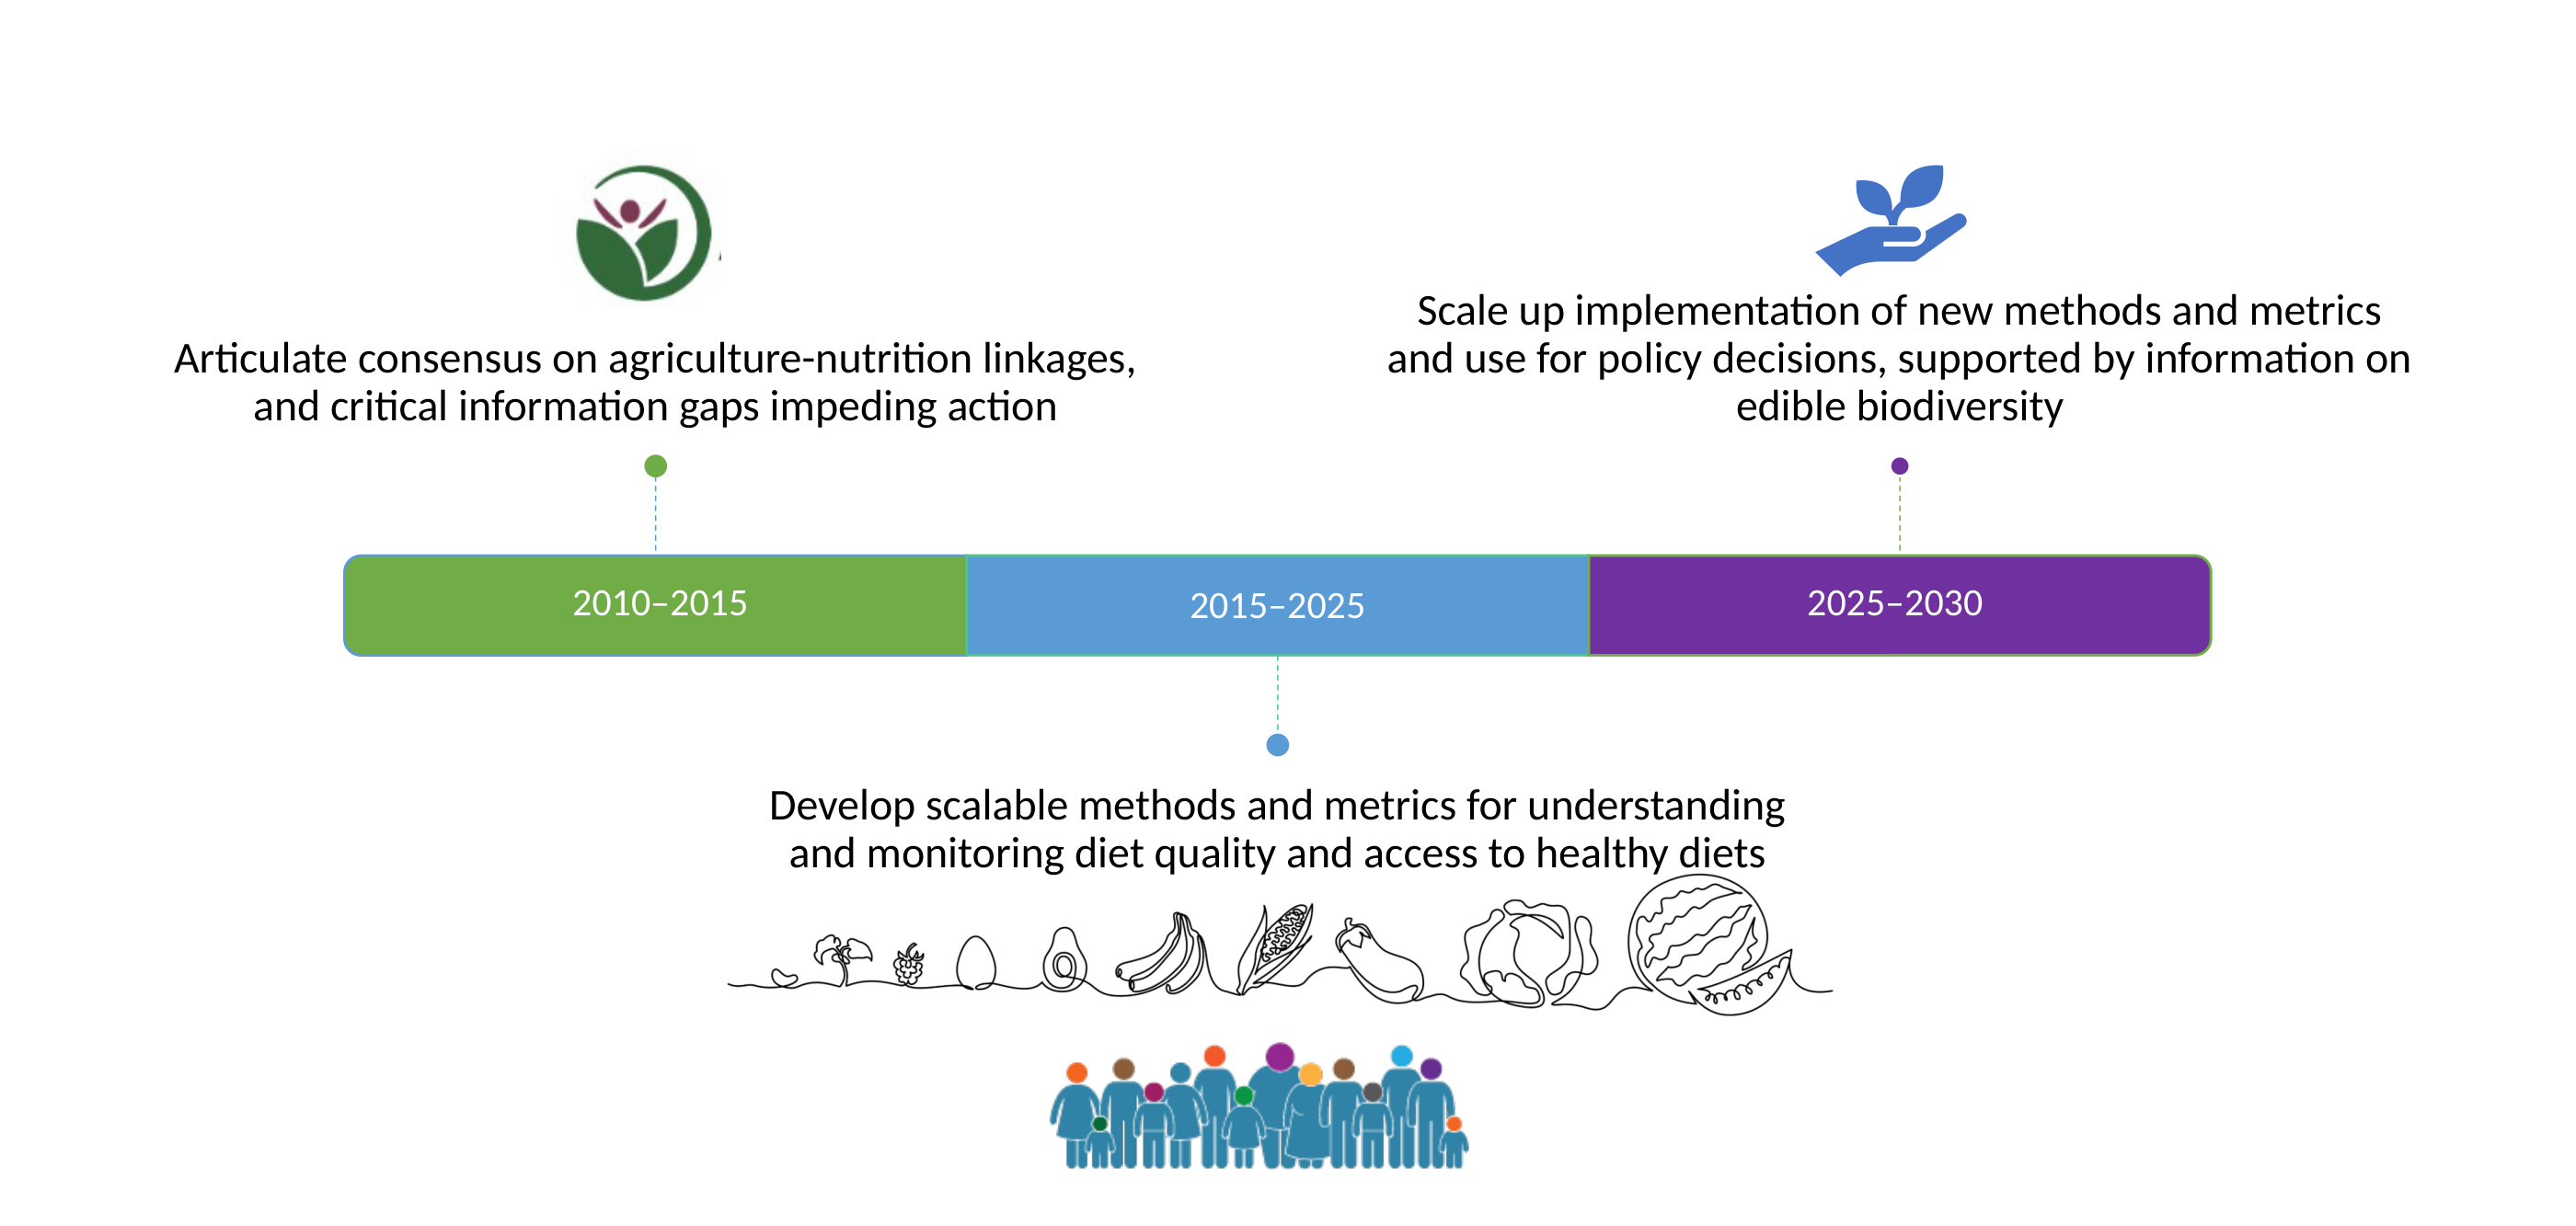
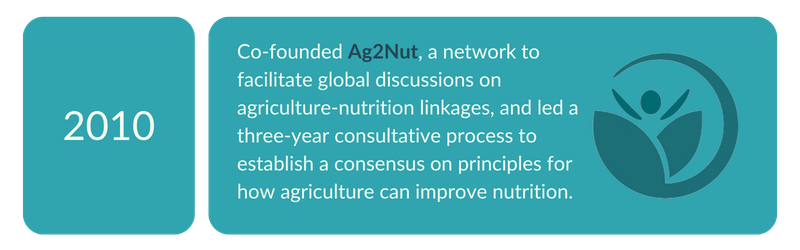
I built consensus around agriculture–nutrition linkages through collaborative processes to shape common understanding and practical application.
Developing the Methods and Metrics
2015 – 2025
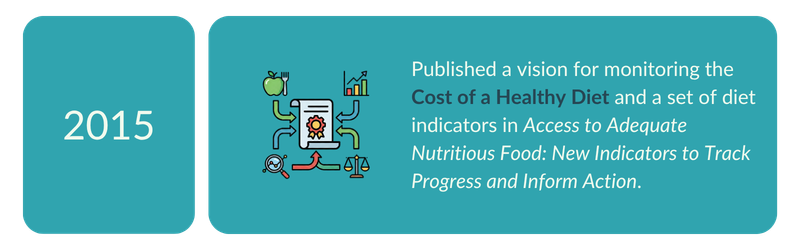
I launched two decade-long projects to develop scalable methods and metrics for monitoring diet quality and access to healthy diets.
Global Mainstreaming
2025 – 2030
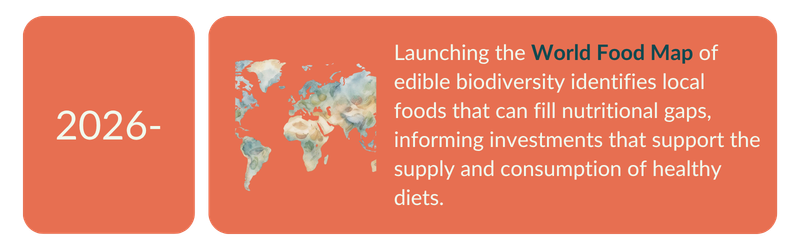
I am scaling up the implementation of new methods and metrics, helping embed them in policymaking, and elevating edible biodiversity to address gaps in food access and diets.
Situation in 2010:
“Nutrition-sensitive agriculture” coined in the SUN movement
Food Systems
Was measured as
dietary energy or
hunger only
No indicators of
dietary intake
measured
I launched two projects in 2015/16 to fill these gaps.
Projects
(2015-2025)
Results
(as of 2025)
Cost and Affordability of a Healthy Diet
View Data on FAOSTAT →Minimum Dietary Diversity:
SDG indicator 2.2.4
Complementary indicators on prevention of diet-related NCDs adopted by WHO